The Problem with Words
Before 2013, computers treated words as atomic symbols. "Apple" and "Orange" were just two different ID numbers, as unrelated as "Apple" and "Car".
We used One-Hot Encoding: a massive vector of zeros with a single '1' at the index of the word.
Apple  = [0, 0, 0, 1, 0, ..., 0]

Orange = [0, 1, 0, 0, 0, ..., 0]

Car    = [0, 0, 0, 0, 0, ..., 1]
The problem? These vectors are orthogonal. The dot product (similarity) between any two words is 0. The computer had no way of knowing that apples and oranges are similar fruits.
Then came Word2Vec (Mikolov et al. at Google), proposing a way to learn Dense Vectors where similar words have similar vectors.
The Core Insight: Distributional Hypothesis
If two words frequently appear in the same context (surrounded by the same words), they likely mean similar things.
Consider these sentences:
- "The dog barked at the mailman."
- "The puppy barked at the mailman."
Because "dog" and "puppy" both appear near "barked" and "mailman", the model learns they are semantically related.
1. Generating Training Data (The Sliding Window)
Word2Vec is a self-supervised model. We don't need human labels; we just need raw text. We create a "fake" task to train the model.
We slide a window over the text. The word in the middle is the Target, and the surrounding words are the Context.
Sliding Window Visualization
2. The Architectures: CBOW vs. Skip-gram
The paper proposed two distinct architectures to learn these relationships.
CBOW (Continuous Bag of Words)
Predict the target word from its context
// Given sentence: "The quick brown fox jumps"


Context (Input): ["The", "quick", "fox", "jumps"]

Target (Output): "brown"


// The model averages the context word embeddings

// and predicts the missing middle word
How it works: Take all surrounding words, average their vectors, and use that to predict the center word.
- Faster to train
- Better for frequent words
- Smooths over distributional information
Skip-gram
Predict the context words from the target
// Given sentence: "The quick brown fox jumps"


Target (Input): "brown"

Context (Output): ["The", "quick", "fox", "jumps"]


// The model uses the target word embedding

// to predict each surrounding word
How it works: Take the center word and use it to predict each of the surrounding words independently.
- Slower (creates more training pairs)
- Better for rare words
- Learns finer-grained relationships
3. The "Fake" Task & The Hidden Layer
Here is the secret: We don't actually care about the prediction.
We train a simple neural network (1 hidden layer, no activation function) to perform this prediction task.
- Input: One-hot vector of a word (size V).
- Hidden Layer: Dense matrix (size V x N). This is the Embedding Matrix!
- Output: Softmax probability over all words (size V).
After training, we throw away the output layer. The weights of the hidden layer are the word vectors we wanted all along. If the hidden layer size is 300, each word is now represented by a vector of 300 numbers.
4. The Mathematical Objective: Likelihood Maximization
Now let's understand the math behind Word2Vec. The goal is to learn word vectors that maximize the probability of seeing the actual context words given the target word (Skip-gram) or vice versa (CBOW).
The Likelihood Function
For Skip-gram, given a sequence of words \( w_1, w_2, ..., w_T \), we want to maximize the likelihood of predicting context words from each target word:
Where \(c\) is the context window size
This is a product of probabilities. For each word \(w_t\), we multiply the probabilities of all its context words.
From Products to Sums: The Log-Likelihood
Products are computationally difficult. We apply the logarithm to convert products into sums:
- \(\log(a \times b) = \log(a) + \log(b)\) — converts products to sums
- Logarithm is monotonic — maximizing \(\log \mathcal{L}\) is equivalent to maximizing \(\mathcal{L}\)
- Prevents numerical underflow (multiplying many small probabilities)
The Softmax Probability
How do we calculate \(P(w_O | w_I)\)? Using the softmax function:
Where \(v_{w_I}\) is the input embedding and \(v'_{w_O}\) is the output embedding
From Maximization to Minimization: The Loss Function
In practice, optimization algorithms minimize functions, not maximize them. We convert our maximization problem into minimization by adding a negative sign:
- Start: Maximize likelihood (product of probabilities)
- Step 1: Take log → product becomes sum
- Step 2: Add negative sign → maximization becomes minimization
- Result: Loss function \(\mathcal{J}\) that we can minimize with gradient descent!
Substituting the softmax probability:
This is the negative log-likelihood loss, also known as cross-entropy loss. The problem? That summation over all \(W\) words in the vocabulary is extremely expensive!
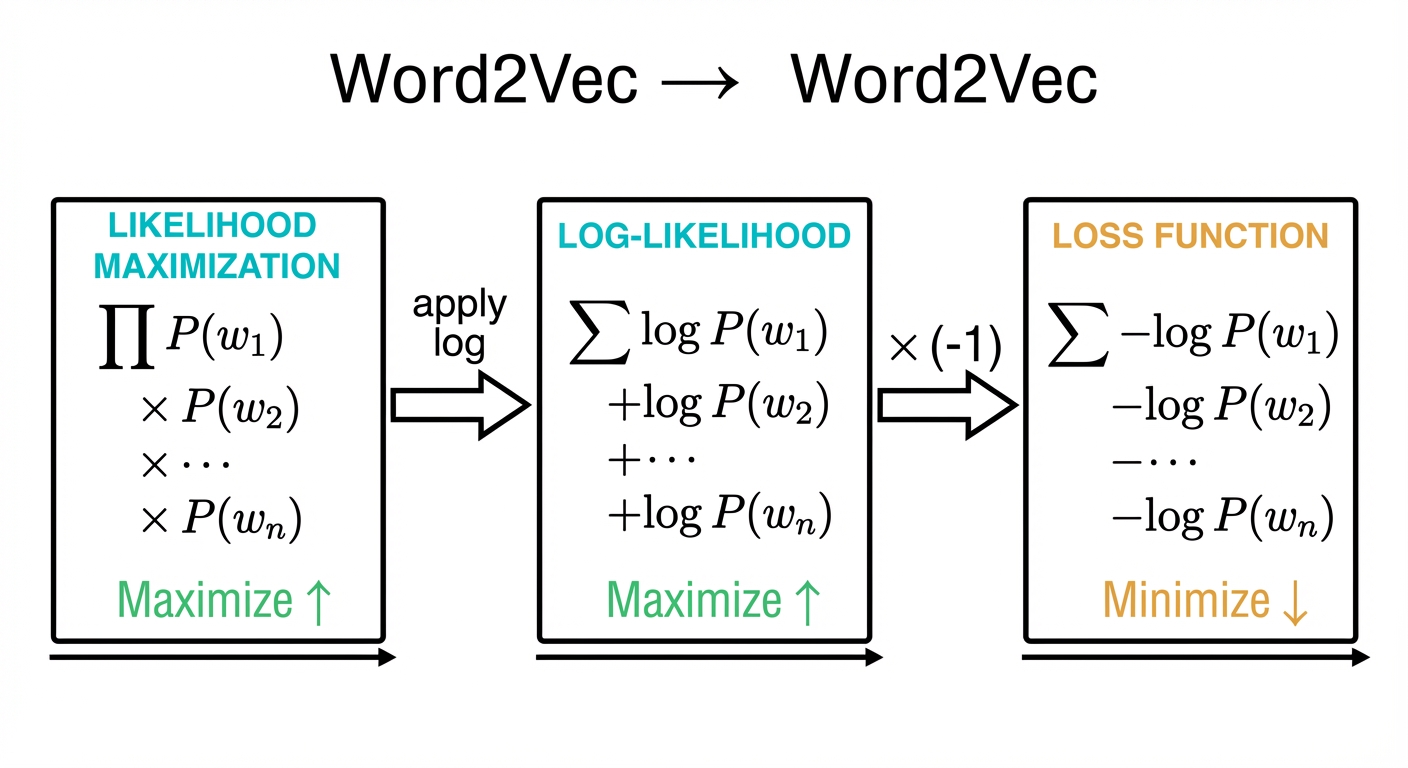
Visual summary: From likelihood maximization to loss minimization
5. Optimization: Negative Sampling
The Computational Problem
Calculating the Softmax over a vocabulary of 100,000+ words for every single training example is incredibly slow. The denominator requires summing exponentials for every word.
For a vocabulary of 100,000 words, we need to compute 100,000 dot products and exponentials for every single training example. With billions of training examples, this becomes computationally infeasible.
The Negative Sampling Solution
Key Insight: Instead of trying to predict the exact probability distribution over all words, we can frame it as a binary classification problem: "Is this word pair (target, context) from the real data or not?"
For each positive example (actual context word), we sample a few (typically 5-20) "negative" examples (random words that aren't in the context). We then train the model to:
- Output high probability (close to 1) for the positive example
- Output low probability (close to 0) for the negative examples
The Negative Sampling Objective
Instead of the full softmax, we use the sigmoid function for binary classification. The formal objective function defined in the paper is:
In practice, for a single training step with \(k\) specific negative samples, this simplifies to:
🎯 The Sigmoid Strategy: Both Aim for 1, Different Paths
The model tries to make both positive and negative pairs achieve a sigmoid output close to 1, but through different mechanisms:
🔵 Positive Pairs
\( v' \cdot v \) → large positive
Goal: \( \sigma(v' \cdot v) \approx 1 \)
Strategy: Align vectors (same direction)
🔴 Negative Pairs
\( v'_{neg} \cdot v \) → large negative
Goal: \( \sigma(-v'_{neg} \cdot v) \approx 1 \)
Strategy: Reverse vectors (opposite direction)
Key Insight: The negative sign inside \( \sigma(-v'_{neg} \cdot v) \) flips the dot product. So when \( v'_{neg} \cdot v \) is large and negative (vectors pointing opposite), \( -v'_{neg} \cdot v \) becomes large and positive, making \( \sigma(-v'_{neg} \cdot v) \approx 1 \). Both formulations reward the model when sigmoid outputs 1, but they achieve this through different vector geometries.
Geometric Result: By minimizing \(J\) over billions of examples, the model learns a vector space where semantically similar words (which appear in similar contexts) are clustered together through alignment, while unrelated words are pushed apart through opposition.
Deep Dive: Deconstructing the Objective Function
Let's break down exactly why the equation looks the way it does, step by step.
A. What We Want to Do
- We want to predict whether a word pair is real (1) or fake (0).
- We want dot products of positive pairs → large positive.
- We want dot products of negative pairs → large negative.
- We want a loss function that rewards correct predictions and punishes wrong predictions.
- We want a loss that uses
sigmoid(probability)and is minimized, not maximized.
B. Why is there a "− INSIDE log"? (sigmoid(-dot))
- For negative samples, the target probability is 0.
Sigmoid(s)= probability of label=1.- Probability of label=0 =
1 - sigmoid(s)=sigmoid(-s). - Therefore, we use
sigmoid(-dot)for negative samples. This forces the dot product to become negative.
C. Why is there a "− OUTSIDE log"? (−log(p))
log(probability)is always negative (since p < 1). We must flip the sign.- We want loss ≥ 0 → need the minus.
- Maximizing
log(p)is equivalent to minimizing-log(p). - Standard binary cross-entropy has a minus sign. Without it, gradients would push in the wrong direction.
D. Cross-Entropy Derivation Structure
- Start from information: \( I(x) = -\log(x) \).
- Entropy = expected information = \( \sum p \log(1/p) \).
- Cross entropy = \( \sum p(x) \cdot [-\log q(x)] \).
- Binary case yields: \( -[ t \log y + (1-t) \log(1-y) ] \).
- Plug \( y = \text{sigmoid}(\text{dot}) \).
E. Final Word2Vec Loss Forms
- Positive sample loss = \( -\log(\text{sigmoid}(\text{dot})) \).
- Negative sample loss = \( -\log(\text{sigmoid}(-\text{dot})) \).
- Full loss = sum over all positives + negatives.
F. Optimization Goals
- Minimize positive loss → increase dot product.
- Minimize negative loss → decrease dot product.
- Dot product increases/decreases via gradient descent updates.
Where \(\sigma(x) = \frac{1}{1 + e^{-x}}\) is the sigmoid function and \(k\) is the number of negative samples (usually 5-20).
// Example: Target word = "fox", Context word = "quick"


Positive pair: ("fox", "quick") → Train to output 1


Negative samples (k=5):

  ("fox", "democracy") → Train to output 0

  ("fox", "pizza")     → Train to output 0

  ("fox", "algorithm") → Train to output 0

  ("fox", "ocean")     → Train to output 0

  ("fox", "guitar")    → Train to output 0
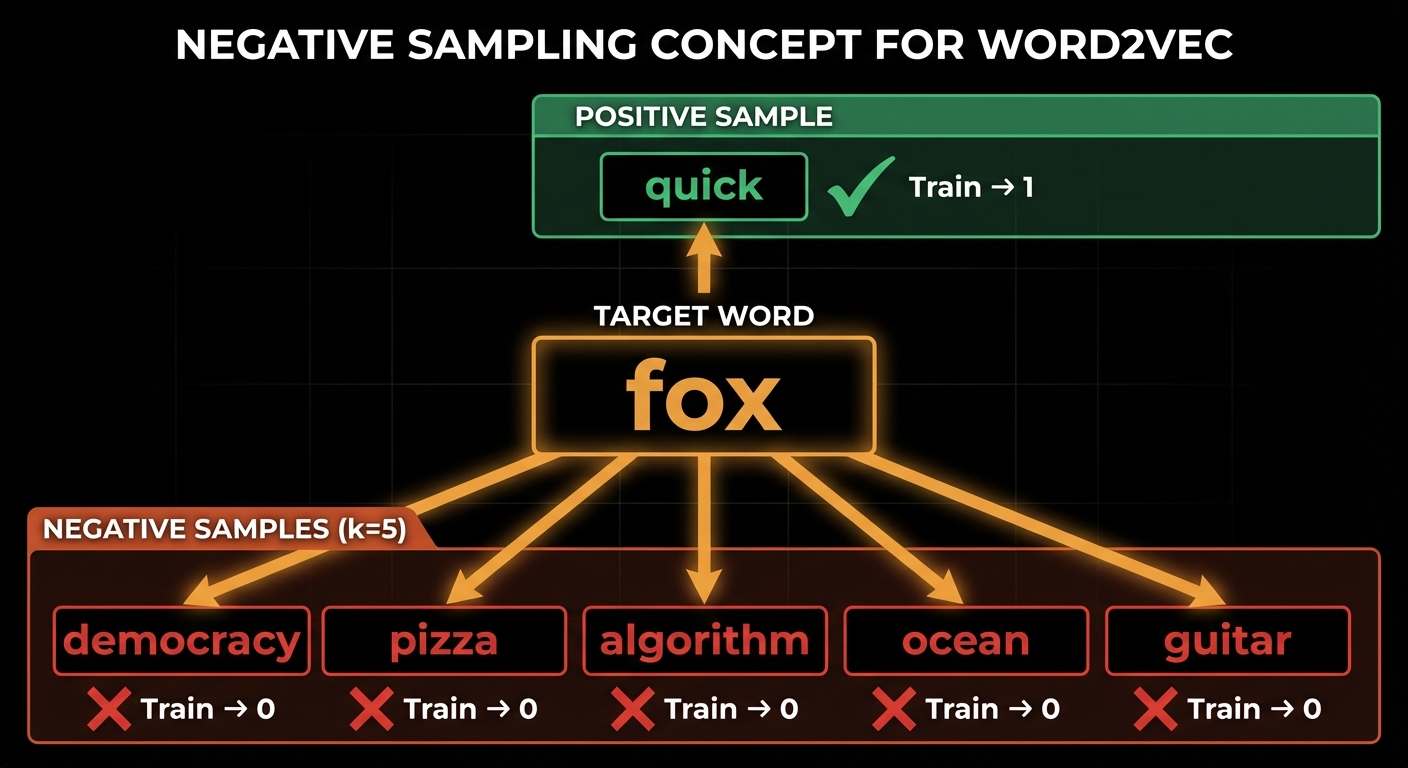
Negative sampling: 1 positive example + k negative examples
How to Sample Negative Examples?
We don't sample uniformly! The paper uses a unigram distribution raised to the 3/4 power:
Where \(f(w_i)\) is the frequency of word \(w_i\) in the corpus
- Uniform sampling (\(P(w) = 1/W\)) gives too many rare words
- Frequency-based sampling (\(P(w) \propto f(w)\)) gives too many common words like "the", "a"
- The 3/4 power is a sweet spot that slightly favors rare words without overwhelming the model
- Example: If "the" appears 1000× more than "giraffe", with 3/4 power it's only sampled ~178× more often
Computational Savings
Instead of computing probabilities for 100,000 words, we now only compute for 1 positive + 5-20 negatives = 6-21 words. This is a ~5000× speedup!
- Full Softmax: O(W) complexity per training example (W = vocabulary size)
- Negative Sampling: O(k) complexity per training example (k = 5-20)
- Result: Training becomes feasible on large corpora with billions of words!
6. The Result: Semantic Arithmetic
The most famous result from the paper was the emergence of linear substructures. The model learned relationships that allowed for vector arithmetic.
If you take the vector for King, subtract the "maleness" vector (Man), and add the "femaleness" vector (Woman), the closest resulting vector in the space is Queen.
Other examples found:
- Paris - France + Italy ≈ Rome (Capital cities)
- Bigger - Big + Small ≈ Smaller (Adjective scaling)
- Einstein - Scientist + Painter ≈ Picasso
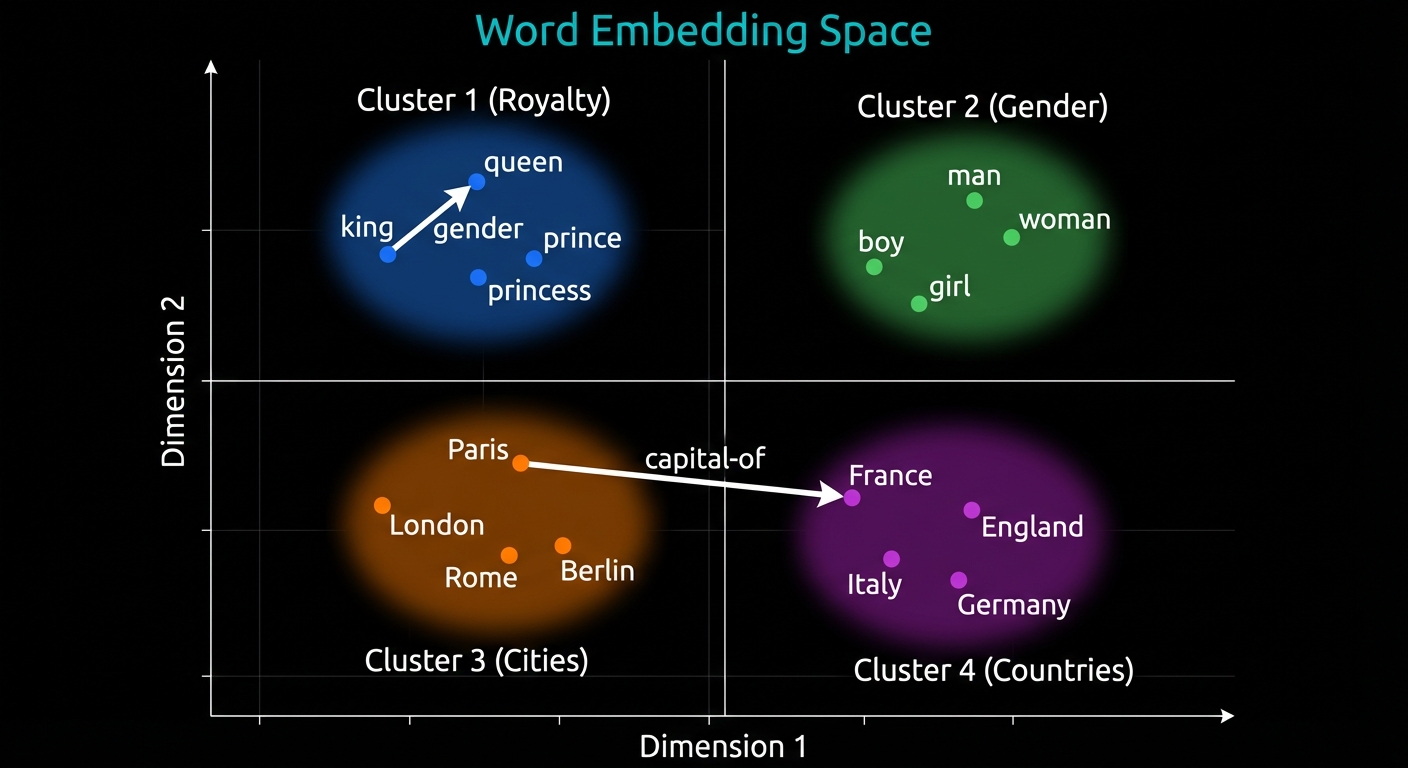
2D projection of word embeddings showing semantic clusters and relationships
7. Training Details & Hyperparameters
Key Hyperparameters
The Word2Vec paper provides specific recommendations for training:
Vector Dimensionality
- Typical: 100-300 dimensions
- Small datasets: 50-100 dims
- Large datasets: 300-500 dims
- Higher dimensions capture more nuance but risk overfitting
Context Window Size
- Skip-gram: 5-10 words
- CBOW: 5-10 words
- Larger windows capture topic similarity
- Smaller windows capture syntactic relationships
Negative Samples
- Small datasets: 5-20 samples
- Large datasets: 2-5 samples
- More negatives = better quality but slower
- Paper recommends 5-20 for best results
Learning Rate & Epochs
- Initial LR: 0.025
- Decay: Linear to 0.0001
- Epochs: 5-15 passes
- Use SGD (Stochastic Gradient Descent)
Subsampling Frequent Words
Common words like "the", "a", "in" appear so frequently that they provide little information. The paper uses subsampling to randomly discard them during training:
Where \(t\) is a threshold (typically \(10^{-5}\)) and \(f(w_i)\) is the word frequency
- Words with frequency > threshold are randomly discarded
- "the" (very frequent) might be discarded 99% of the time
- "giraffe" (rare) is almost never discarded
- Speeds up training 2-10× while improving quality
Implementation
You can find my full implementation of the paper from scratch on GitHub: word2vec-implementation
Conclusion
Word2Vec was a pivotal moment in AI. It showed that simple neural networks, given enough data, could capture complex human concepts like analogy and semantic relationship without being explicitly taught grammar or logic.
Why Word2Vec Matters
- Simplicity: Just a 2-layer neural network with no complex architecture
- Efficiency: Negative sampling made training on billions of words feasible
- Generality: Works across languages, domains, and even non-text data
- Foundation: Paved the way for modern NLP (BERT, GPT, etc.)
Modern Context
While we now use Transformers and Contextual Embeddings (like BERT and GPT), Word2Vec remains:
- Widely used for lightweight applications and small datasets
- Educational — the best introduction to embeddings and representation learning
- Still relevant in production systems where speed matters more than perfect accuracy
- Words are represented as dense vectors in continuous space
- Similar words have similar vectors (measured by cosine similarity)
- The model learns by predicting context from target (Skip-gram) or vice versa (CBOW)
- Negative sampling makes training computationally feasible
- The resulting embeddings capture semantic and syntactic relationships