What is Maximum Likelihood Estimation?
Maximum Likelihood Estimation (MLE) is one of the most fundamental concepts in statistics and machine learning. It answers a simple question: Given some observed data, what parameters of our model make this data most likely?
MLE is everywhere in machine learning:
- Training linear regression models
- Fitting probability distributions
- Learning neural network weights
- Estimating parameters in statistical models
The Core Intuition
Imagine you have a coin, and you flip it 10 times. You get 7 heads and 3 tails. What's the probability that this coin lands on heads?
Your intuition probably says: "Well, 7 out of 10 flips were heads, so the probability is probably around 0.7 (70%)." That intuition is exactly MLE!
Example: Coin Flip
Observed data: 7 heads, 3 tails
Question: What value of \( p \) (probability of heads) makes this observation most likely?
MLE answer: \( \hat{p} = \frac{7}{10} = 0.7 \)
MLE formalizes this intuition mathematically. It finds the parameter values that maximize the probability (likelihood) of observing the data we actually observed.
Mathematical Framework
Likelihood Function
Given observed data \( X = \{x_1, x_2, \ldots, x_n\} \) and a model with parameters \( \theta \), the likelihood function is:
This reads as: "The likelihood of parameters \( \theta \) given data \( X \) equals the probability of observing \( X \) if \( \theta \) were the true parameters."
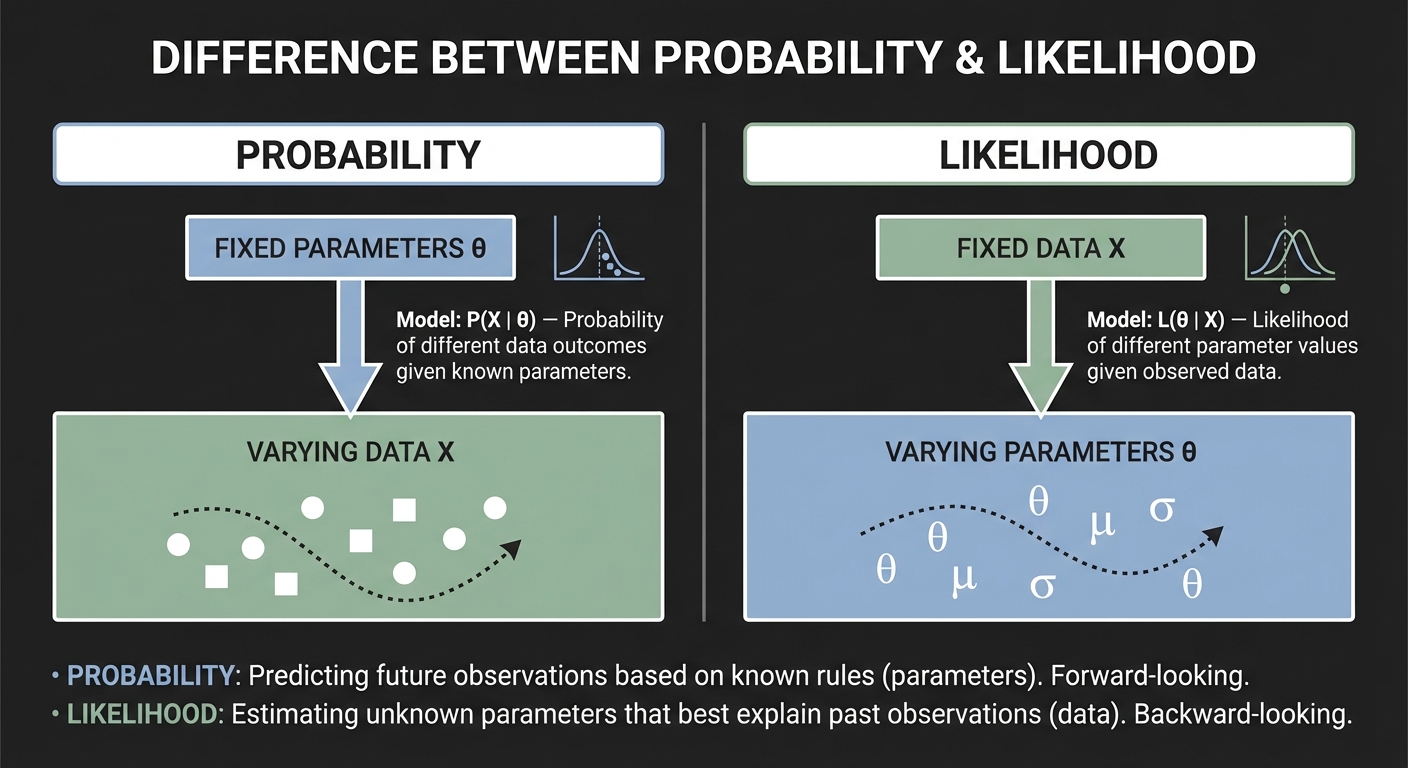
Figure 1: The key difference between probability and likelihood
Log-Likelihood
Products are hard to work with mathematically. Since logarithm is monotonically increasing, maximizing \( \mathcal{L}(\theta) \) is equivalent to maximizing \( \log \mathcal{L}(\theta) \):
The log-likelihood turns products into sums, which are much easier to differentiate and optimize.
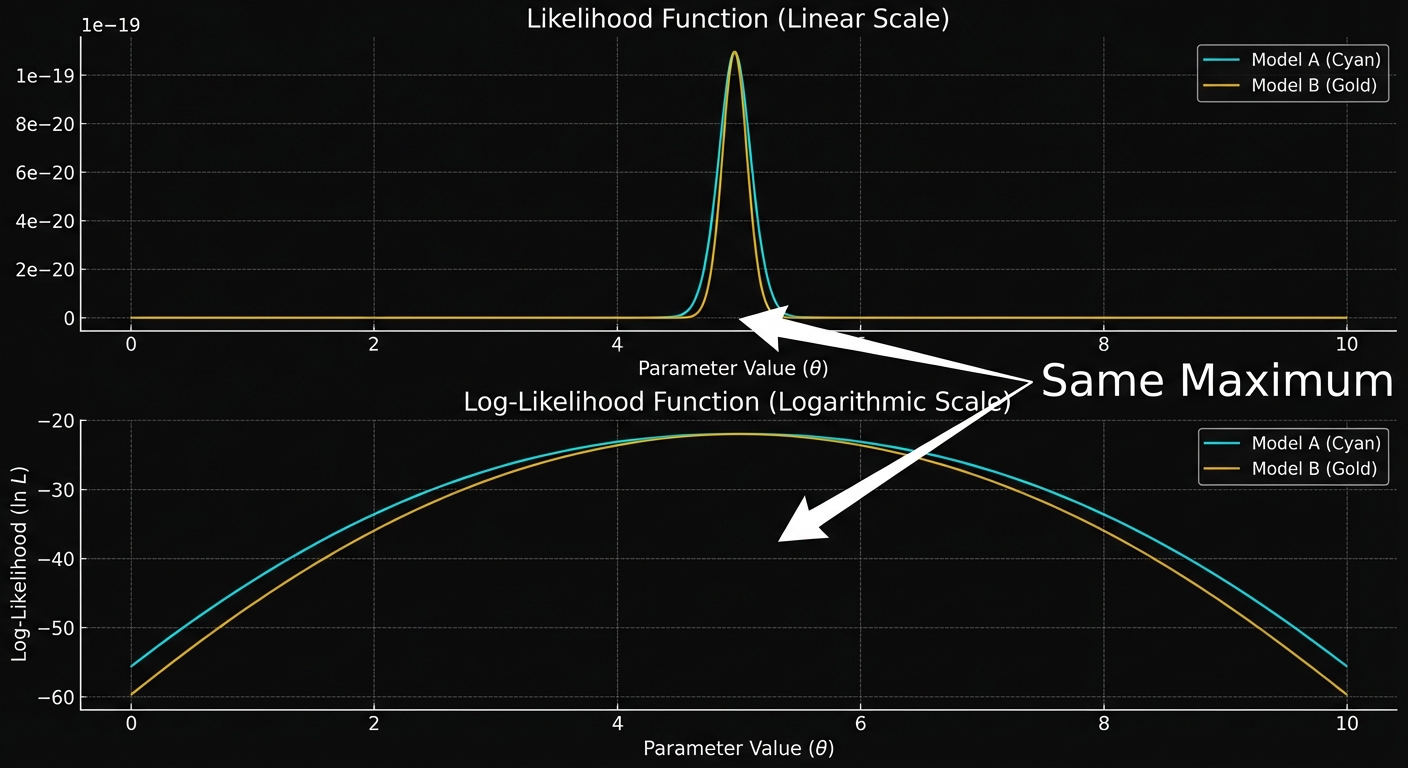
Figure 2: Why we use log-likelihood - same maximum, easier optimization
Finding the Maximum
To find the MLE, we take the derivative of the log-likelihood with respect to \( \theta \), set it to zero, and solve:
This gives us the critical points. We verify it's a maximum (not minimum) by checking the second derivative is negative.
Example 1: Bernoulli Distribution (Coin Flips)
Let's formalize the coin flip example mathematically.
Step 1: Define the Model
Each coin flip follows a Bernoulli distribution with parameter \( p \) (probability of heads):
where \( x_i = 1 \) for heads, \( x_i = 0 \) for tails.
Step 2: Write the Likelihood
For \( n \) independent flips with \( k \) heads:
Step 3: Take the Log-Likelihood
Step 4: Differentiate and Set to Zero
Step 5: Solve for \( p \)
Result
The MLE for the Bernoulli parameter is simply the proportion of successes:
For our example with 7 heads out of 10 flips: \( \hat{p} = \frac{7}{10} = 0.7 \)
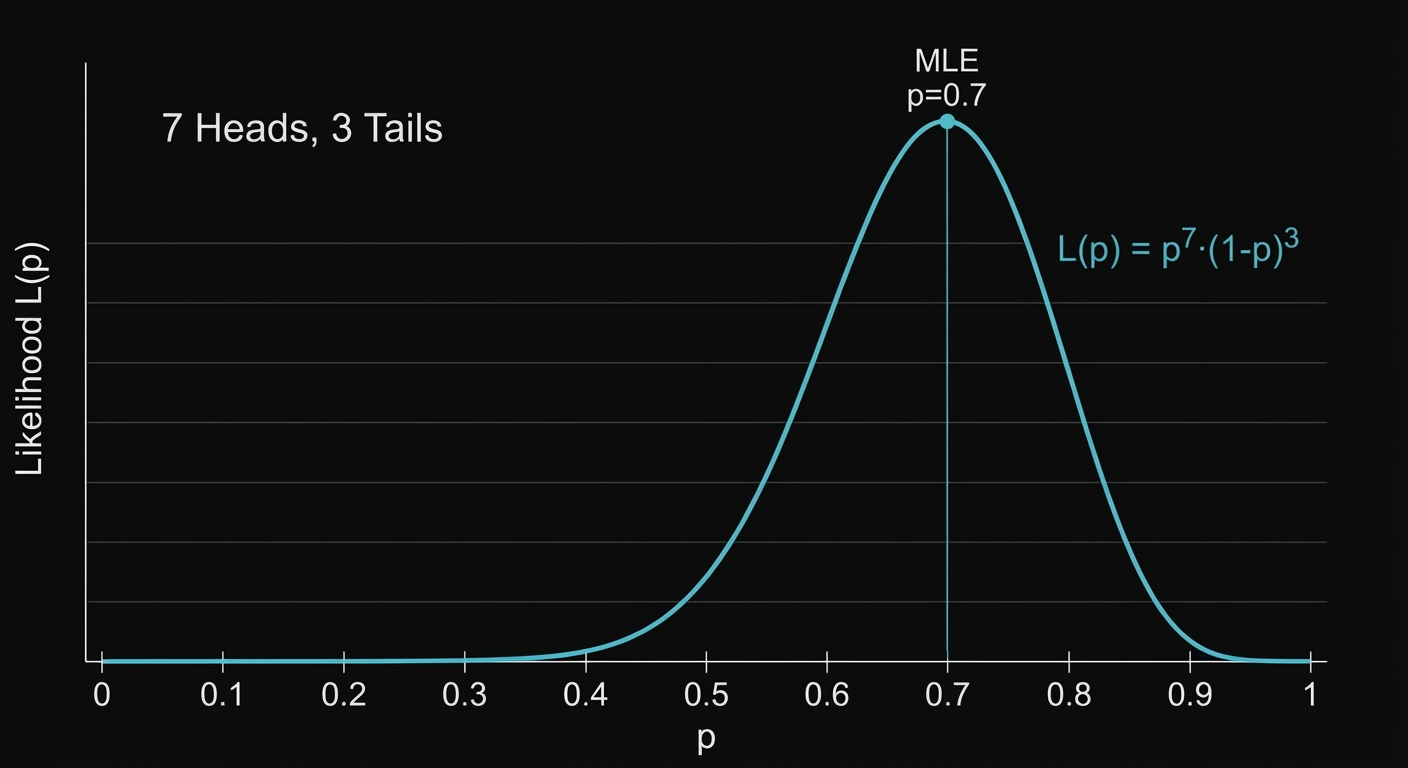
Figure 3: Likelihood function for coin flip example - peaks at p=0.7
Example 2: Normal Distribution
A more complex example: estimating the mean \( \mu \) and variance \( \sigma^2 \) of a normal distribution from data.
Step 1: Normal Distribution PDF
Step 2: Likelihood for \( n \) Observations
Step 3: Log-Likelihood
Step 4: Maximize with Respect to \( \mu \)
Take derivative with respect to \( \mu \) and set to zero:
Solving:
Step 5: Maximize with Respect to \( \sigma^2 \)
Take derivative with respect to \( \sigma^2 \) and set to zero:
Solving:
Result
The MLE estimates for a normal distribution are:
- Mean: Sample mean \( \hat{\mu} = \bar{x} \)
- Variance: Sample variance \( \hat{\sigma}^2 = \frac{1}{n}\sum(x_i - \bar{x})^2 \)
Note: The MLE for variance is biased (uses \( n \) instead of \( n-1 \)). The unbiased estimator uses \( n-1 \).
Connection to Linear Regression
Linear regression can be derived using MLE! This shows how fundamental MLE is to machine learning.
The Setup
Assume our data follows:
This means \( y_i \) is normally distributed around the prediction:
Likelihood
Log-Likelihood
Maximizing
Maximizing the log-likelihood is equivalent to minimizing:
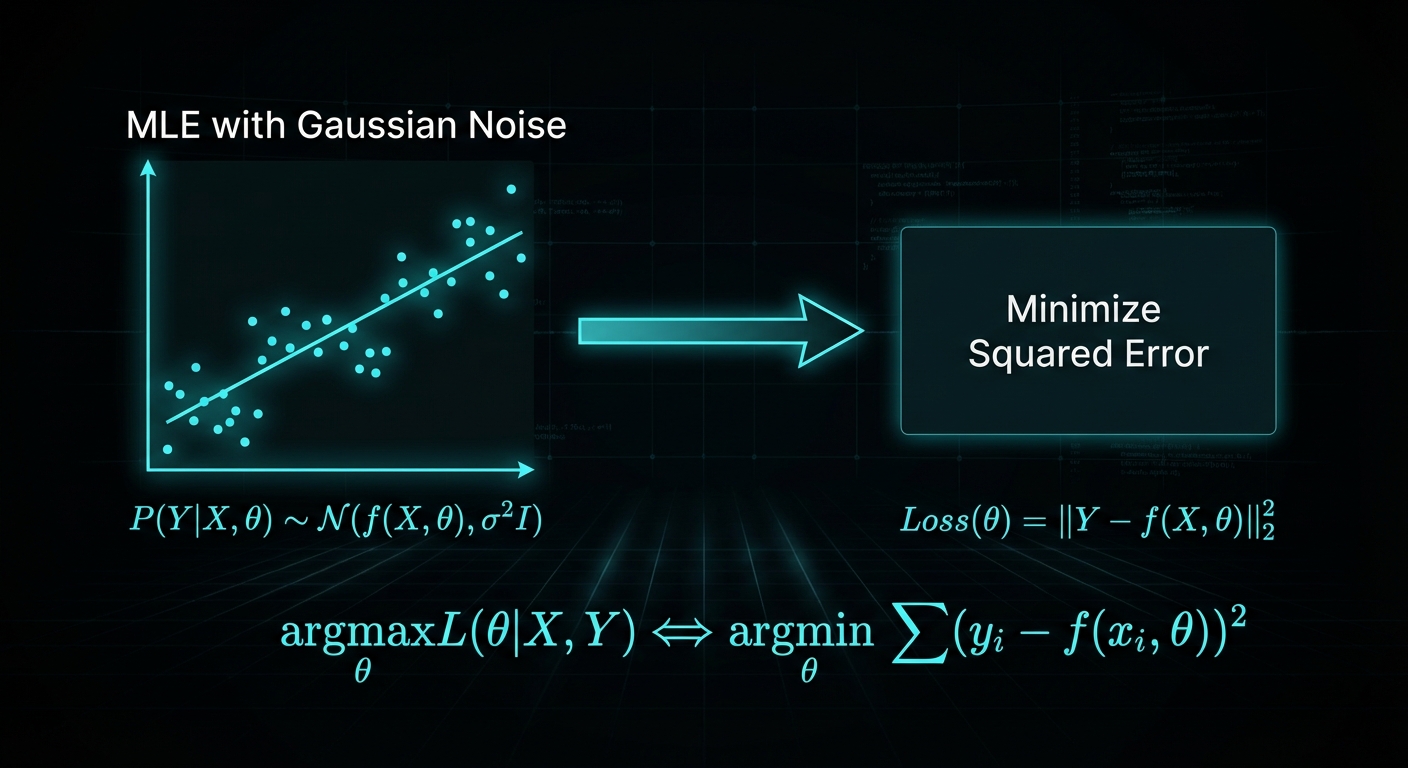
Figure 4: How MLE under Gaussian noise leads to least squares regression